
Automatically Generating NBA Rosters for BasketballGM
BasketballGM is a remarkable, free, browser-based game. I decided to automatically generate roster files from real NBA data using some basic data science methods. The results are all on this GitHub repo and the roster files are available here
BasketballGM Ratings
As outlined on the player customization page, players in BBGM have 15 ratings which determine their performance.
- hgt: height, which factors into pretty much everything
- stre: strength, which influences defense, rebounding, and low post scoring
- spd: speed, which influences ball handling, fast breaking, and defense
- jmp: jumping, which influences finishing at the rim, rebounding, blocking shots, and defense
- endu: endurance, which governs how fast a player’s skills degrade as he gets tired
- ins: low post scoring
- dnk: dunking/layups
- ft: free throw shooting
- fg: 2 point jump shot ability
- tp: 3 point shooting
- oiq: offensive IQ
- diq: defensive IQ
- drb: dribbling
- pss: passing
- reb: rebounding
This is a sensible decomposition of latent performance variables. Unfortunately, it’s not totally clear how to set these manually. For example, take 3Pt shooting. Shooting percentage? Domantas Sabonis shot over 50% on 3P (on 17 attempts). Total makes? Harden made 378 3P but Steph Curry made 354, with 200 less 3PA. Even worse are variables like jmp or drb, which I have no idea how to set correctly for large numbers of players.
So instead, we’ll build a model to understand these underlying variables.
Building a model
What type of model? In general, we want a model that takes data we have, and generates data we want. It’s clear we want the underlying variables. As for what data do we have? Box score statistics, like this page for LeBron James. This is your typical stat sheet, Rebounds, Points, Steals, etc. Since we’re using modern NBA data, we also have per possession and per minute versions of these statistics.
Our basic model will be a linear regression, which is just a weighted sum. For example, we might get that a player’s jump score can be derived as Jump = 0.3 * Blk_p36 - 0.4 * Height - 0.4 * Age + 0.2 * MP. Stated in plain words, this means that a player who is young, plays a lot of minutes, and gets a lot of blocks would tend to have a high jump rating. We’ll whiten the data first, so all of these are in consistent units, which are standard devations above/below the mean. Thus, all these stats are always measured against league average.
This idea is hardly new. This is Box Plus Minus basically works, it’s a model from box score data to something like Ridge-Regressed APM. There are many versions of this, such as those from Dan Rosenbaum and Scott Sereday. Further, Ben Taylor has built models to measure Shot Creation, Passer Rating and Offensive Load.
Getting NBA data
I decided to use the wonderful Basketball Reference as a data source. I have a small script (save_season.py) which downloads the team-by-team pages for a given season, along with the contract files (which are always “as of today” and don’t provide historical data). I extract all the tables from the pages and save them into Python pickle objects.
Getting BBGM data
This step is really easy, grab some simulated BasketballGM seasons, and export the league statistics. I used data from a league I’d been playing with (~120,000 players). This exports box score data in per game averages, along with a few advanced stats. Now we have a dataset of BBGM data where we know both the underlying player ratings, and what box score data they generated.
One huge benefit is that this captures all the simulation quirks of BBGM, such as the significant impact that height has a player’s performance. If BBGM changes how it does simulation, we can simply autoplay a few dozen seasons and build a new model.
With this, we fit a standard regularized linear regression model for all the underlying variables.
Results
Now that we have a model and a way to obtain NBA box score data, we can build a roster automatically. And we can do it for any year, thereby also obtaining old draft classes (just use the rookie year data). For the current season, we can also automatically setup all the player contracts. Since it’s automatic, we can just as easily build rosters for 1985, 1992, 2010 or 2012 as we can for 2019. Except 2019 lacks accurate draft classes (I don’t currently use college data, although one could), and all other years lack player contract data.
There are a few caveats 1) This is just a statistical regression; it’s a linear model and it’s far from perfect. 2) This is just based on box score data; it doesn’t factor in teammate performance, injuries or coasting during the regular season. 3) Heights are a 50/50 blend of the real player height and the maximum of their real height and estimated height. 4) Players not playing enough minutes (around 500) are averaged towards league average.
For the 2018-2019 season, my current configuration produced the top players as James Harden (ovr:78), Paul George (ovr:72), LeBron James, Anthony Davis, Kawhi Leonard, Damian Lillard, Stephen Curry (ovr:71). The highest potential players are Luka Doncic (ovr: 65, pot:78), Lauri Markkanen (ovr: 62, pot: 74), and the aforementioned James Harden. The Top 10 teams were GSW, UTA, BOS, MIL, PHI, DEN, WAS, HOU, TOR, BKN (no injuries).
Comparing the results against standard rosters
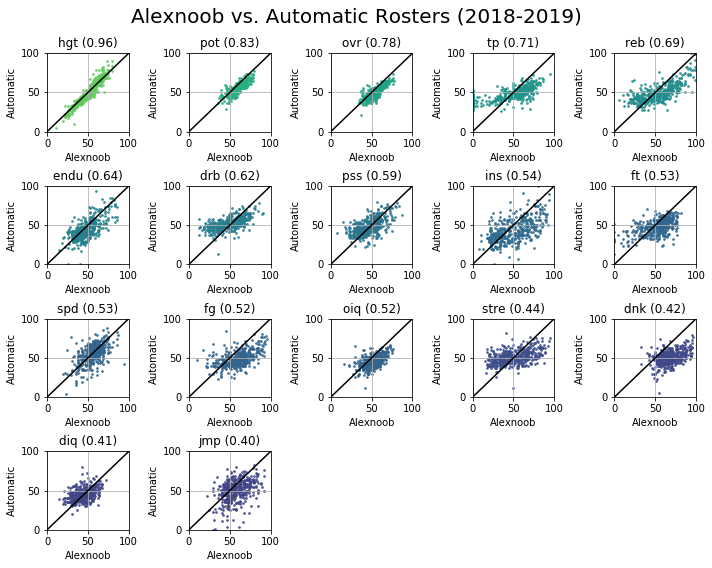
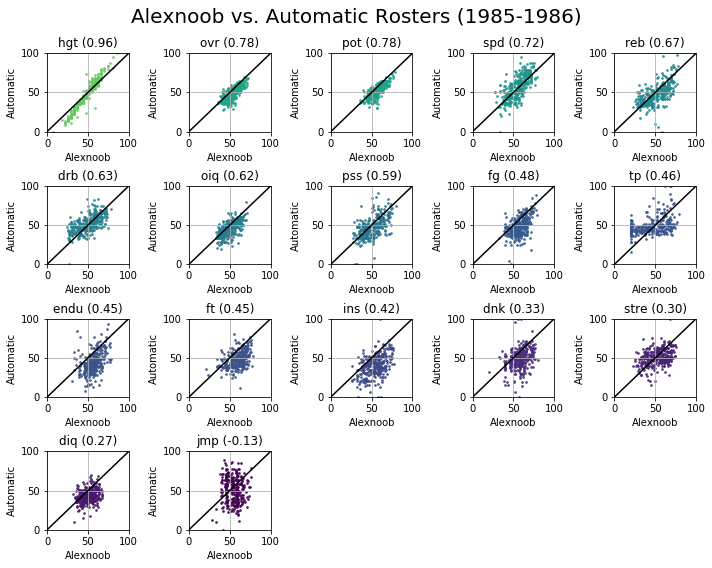
Alexnoob’s rosters are the best curated set in the BBGM community. We can compare his rosters against the automatic ones. X axis is a score alexnoob gave someone. Y axis is the automatic score. The plots are ordered/colored by how well they correlate with each other. This highlights where it’s easy to score players (overall, rebounding, 3p%) and where it’s hard (jmp, diq).
Analyzing the model
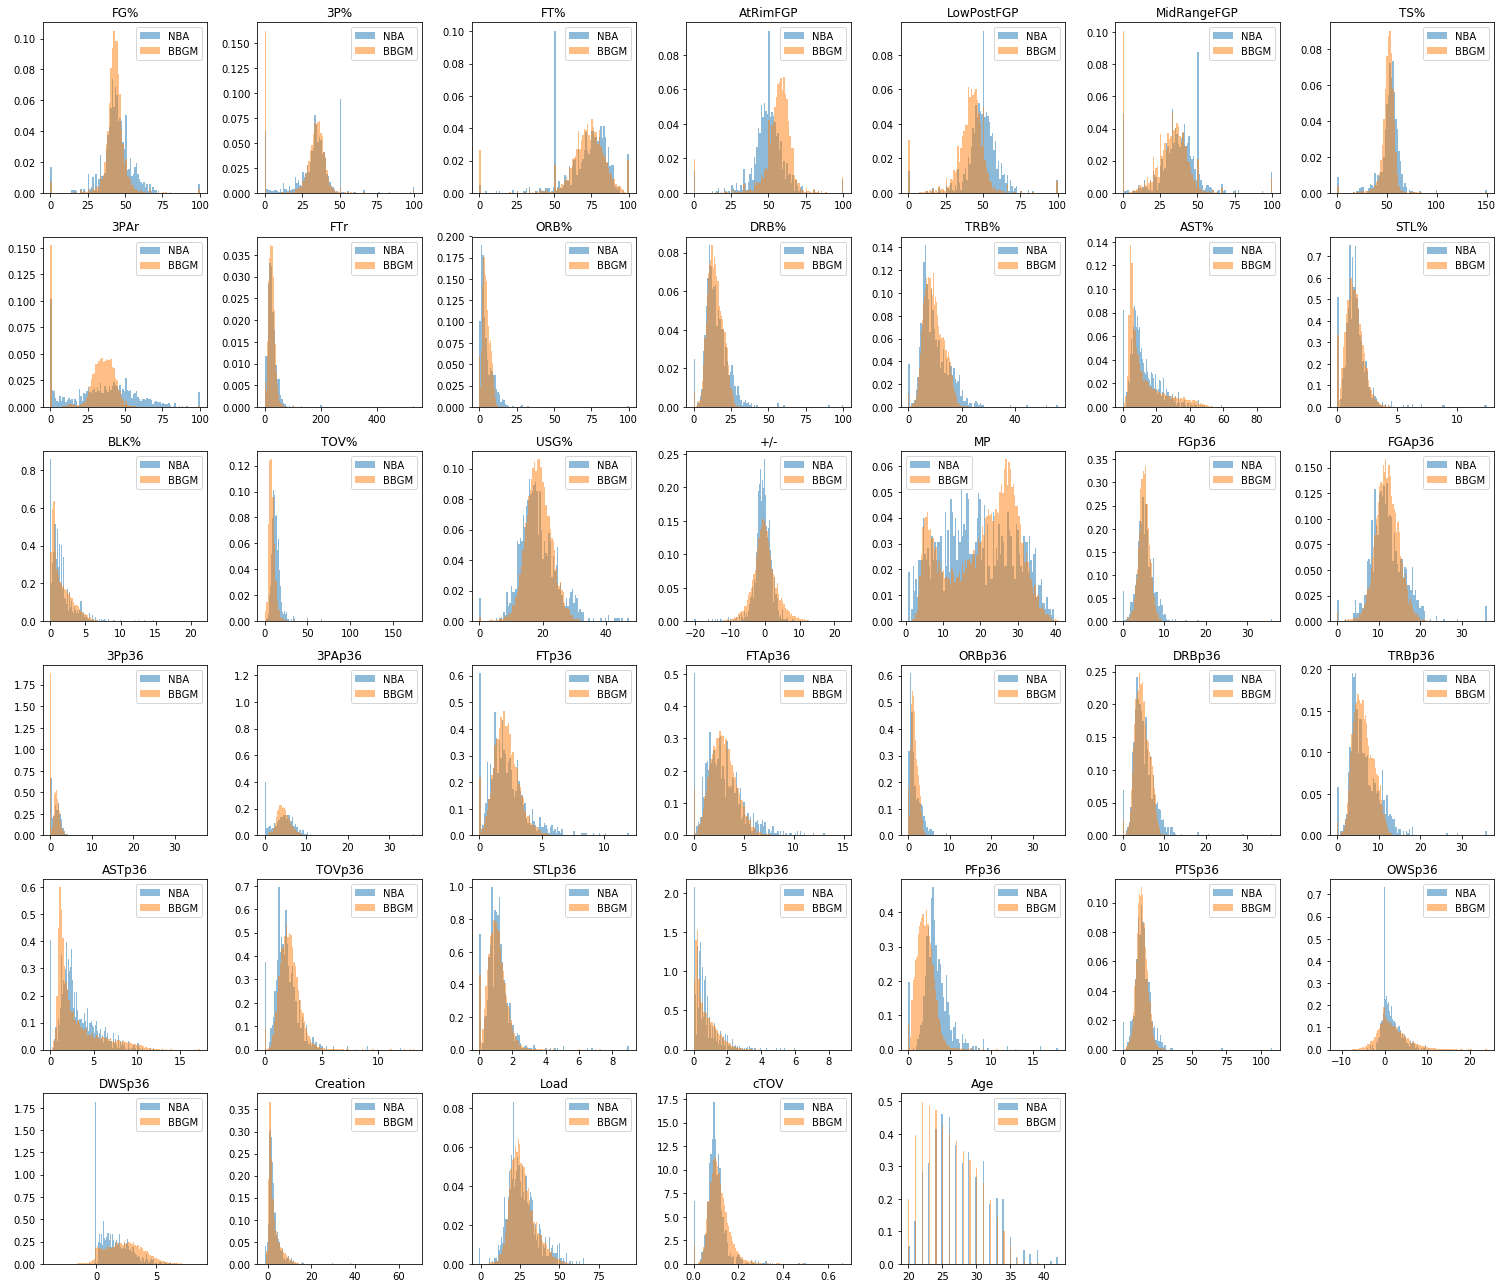
So let’s take a look at what the model uses to produce the 15 ratings for BasketBallGM. As is well known, height highly impacts a player’s performance in BBGM. If you include it as an input feature, almost all scores will have a negative value for height. Why? Because extra height helps box score stats so all the other variables have to subtract a bonus for height first. For this analysis, (Release 0.2 on GitHub), the input features were ‘FT%’, ‘PER’, ‘3PAr’, ‘FTr’, ‘+/-‘, ‘MP’, ‘FGp36’, ‘FGAp36’, ‘3Pp36’,’3PAp36’, ‘FTp36’, ‘FTAp36’, ‘ORBp36’, ‘DRBp36’, ‘TRBp36’, ‘ASTp36’,’TOVp36’, ‘STLp36’, ‘Blkp36’, ‘PFp36’, ‘PTSp36’, ‘Creation’, ‘Load’,’cTOV’, ‘DPM’, ‘OPM’, ‘BPM’, ‘Age’, ‘DRE’, ‘2Pp36’, ‘2PAp36. Some sensitivity analysis would be great here but I haven’t done that yet. Remarkably, although I perform standard scaling before passing real data through the model, the unscaled NBA data looks very similiar to BBGM data. Well done Jeremy!
Now we’ll analyze the 5 largest coefficients to see how the latent variables in BBGM get expressed in performance.
Height
| Variable | Coeff |
|---|---|
| Blkp36 | 0.53 |
| PFp36 | 0.46 |
| DRBp36 | 0.20 |
| TRBp36 | 0.20 |
| ORBp36 | 0.17 |
The most important variable in BBGM. Predicted by fouls, blocks and rebounding. If fouls predict height, then our other variables will use fouling a surrogate for height, and try to remove the effect of height. Expect a lot of negative PFp36, BLK% and Blkp36 for the other statistics.
Strength
| Variable | Coeff |
|---|---|
| MP | 0.31 |
| FTAp36 | 0.29 |
| 2Pp36 | 0.19 |
| PFp36 | -0.16 |
| ASTp36 | -0.35 |
Strong players play more minutes, take a lot of free throwns and have low assist numbers
Speed
| Variable | Coeff |
|---|---|
| Blkp36 | 0.42 |
| TRBp36 | -0.25 |
| ORBp36 | -0.28 |
| Age | -0.29 |
| PFp36 | -0.56 |
Speedy players play a lot of minutes, don’t rebound much and aren’t very old.
Jumping
| Variable | Coeff |
|---|---|
| Blkp36 | 0.56 |
| Age^2 | -0.21 |
| TRBp36 | -0.24 |
| Age | -0.46 |
| PFp36 | -0.47 |
Players with good vertical are young and block well.
Endurance
| Variable | Coeff |
|---|---|
| MP | 0.44 |
| MP^2 | 0.25 |
| STLp36 | 0.19 |
| FGp36 | 0.19 |
| Age^2 | -0.76 |
Younger players who play a lot of minutes have a lot of endurance.
Inside
| Variable | Coeff |
|---|---|
| FGAp36 | 0.38 |
| TOVp36 | 0.38 |
| FTAp36 | 0.31 |
| cTOV | 0.19 |
| Blkp36 | -0.25 |
Inside players take a lot of field goals, free throws, and commit a lot of turnovers.
Dunking
| Variable | Coeff |
|---|---|
| FTAp36 | 0.46 |
| Age^2 | 0.26 |
| FGAp36 | 0.22 |
| MP | 0.21 |
| ASTp36 | -0.54 |
Shooting a lot of free throws and not passing is indicative of being a dunker.
Free Throws
| Variable | Coeff |
|---|---|
| FT% | 0.72 |
| FT% MP | 0.39 |
| MP | 0.12 |
| 3PAp36 | 0.10 |
| FTr | -0.20 |
Free throw shooting is predicted by shooting a lot of free throws and playing a lot of minutes.
Two Pointers
| Variable | Coeff |
|---|---|
| FGAp36 | 0.35 |
| FT% | 0.20 |
| MP | 0.20 |
| cTOV | -0.23 |
| FTr | -0.57 |
Shooting 2 pointers is predicted FGA and FT%, but low free throw rates.
Three Pointers
| Variable | Coeff |
|---|---|
| 3PAr | 0.53 |
| 3Pp36 | 0.28 |
| 3PAp36 | 0.18 |
| 3PAr 3PAp36 | 0.12 |
| FTr | -0.18 |
Shooting 3 pointers is predicted what fraction of your shots are from 3, along with 3P and 3PA.
Offensive IQ
| Variable | Coeff |
|---|---|
| ASTp36 | 0.29 |
| MP | 0.27 |
| FTAp36 | 0.26 |
| cTOV | -0.40 |
| Blkp36 | -0.44 |
Offensive IQ has low turnovers and lots of assists.
Defensive IQ
| Variable | Coeff |
|---|---|
| STLp36 | 0.70 |
| ORBp36 | 0.33 |
| Age | 0.28 |
| TRBp36 | 0.27 |
| Blkp36 | -0.33 |
Older players with good rebounding and a high number of steals are smart defensive players.
Dribbling
| Variable | Coeff |
|---|---|
| ASTp36 | 0.79 |
| OPM | 0.10 |
| Creation | 0.07 |
| ASTp36^2 | -0.12 |
| PFp36 | -0.14 |
Players who dribble well tend to pass well and create shots for others.
Passing
| Variable | Coeff |
|---|---|
| ASTp36 | 0.88 |
| TOVp36 | 0.21 |
| MP | 0.13 |
| Creation | 0.12 |
| PFp36 | -0.14 |
Passing looks like dribbling.
Rebounding
| Variable | Coeff |
|---|---|
| ORBp36 | 0.57 |
| TRBp36 | 0.46 |
| DRBp36 | 0.40 |
| PFp36 | -0.32 |
| Blkp36 | -0.43 |
Rebounders tend to have good rebounding rates.
Compared to AlexNoob
For 2019, the following players had large drops in overall rating compared to Alexnoob’s roster: Avery Bradley (-15), Russell Westbrook (-15), Austin Rivers (-13), OG Annuboy (-13), Kevin Knox (-12), Brandon Ingram (-8). Small usage players like Ekpe Udoh got a large boost (+16). Of players with significant minutes, Trae Young, Miles Plumlee, Timofey Mozgov, Michael Carter-Williams all got boosts of +4.
Normalizing Rosters
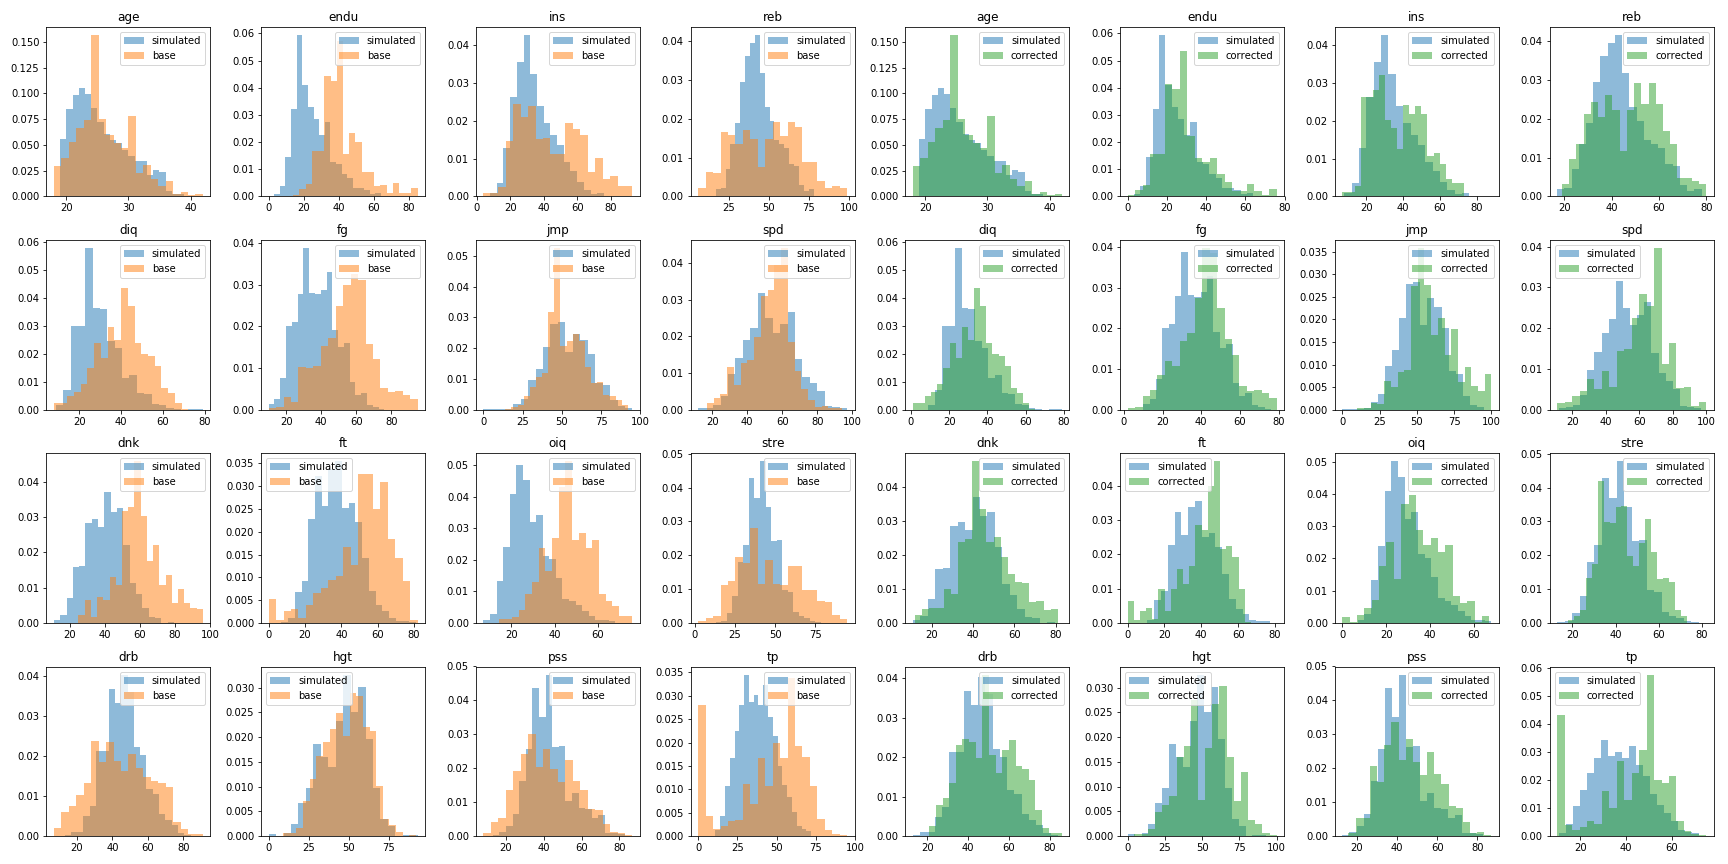
If you don’t trust the automatic rosters, and really love Alexnoob’s rosters, urge you to consider using normalized rosters. Normalization here just means – shift the distribution of ratings so they match the natural distribution of ratings. You can see what the before (left, orange) and after (right, green) distributions look like for the 15 ratings, compare to the blue data from randomly generated BBGM seasons. I also include normalized rosters on my GitHub releases page, and the notebook correct_base.ipynb performs the correction.
Since this is just a scale and shift for each rating, the changes are monotonic. If AlexNoob gave someone a higher rebounding score than someone else, they’ll still have a higher score in this corrected version. However, since this is done independently by category, it may change the overall scores. The automatically generated players from future seasons should also blendly smoothly with existing rosters, as they have similiar distributions.