
FiveThirtyEight's Elo Ratings and Logistic Regression
Inspired by FiveThirtyEight’s update of their CARMELO NBA player projections, a recent conversation on Twitter brought up the value of Elo Ratings. I decided to re-implement 538’s NBA Ratings and tried out a few improvements and variations. The code is all available on this GitHub repo. TLDR: Elo is simple, robust, and works pretty well.
What is Elo?
Basic Elo
Personally, I find the Elo Wikipedia page interesting but not helpful to beginners, so here’s mine. Classically, Elo is a rating system that only uses win and losses to measure performance. Initially, every competitor is assigned an initial rating (538 NBA uses 1300). Higher ratings are taken to mean better teams. To figure out if team A will beat team B, you first compute the difference between their scores. To map this difference into probabilities, we use a sigmoid function, namely the logistic. What’s a sigmoid? In this case, it’s a function that maps \( (-\infty,+\infty) \to [0,1]\), where \(\sigma(0) = 0.5\).
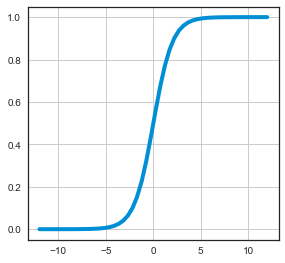
What’s great is that the logistic function will take any number and turn it a probability, so we just put in the difference between Elo Ratings. If the ratings are equal, the difference is zero, and we get 50-50 (0 maps to 0.5!). If your score is higher, the difference is positive, so you get a probability greater than 0.5. The larger the score difference, the larger the probability difference. Additionally, \( \sigma(-x) = 1-\sigma(x) \), so flipping the sign of the score difference produces 1 minus the probability.
There exists a scale that determines how sharp that curve is, which most Elo variants set scale to 400. Roughly, 400 means if you’re +100, you win 64% of the time, +200 75%, +400 91%, etc. Most people familiar with machine learning have seen the logistic function as \(\frac{1}{1+e^{-x}}\), but Elo is usually written with the base-10 variant. They’re basically equivalent, you just have to adjust the scale (400 in base-10 is 173 in base-e).
When we observe an outcome, we give the winner some fraction of K points, and take away the same amount from the loser. How big of a fraction? The loser’s probability of winning. The more likely you are to win, the fewer points you get. Equal odds? 50% of K. You had a 90% chance of winning and won, 10% of K. A 10% chance of winning and won, 90% of K.
That’s it. That’s all of Elo.
Elo Formulas
More formally, we have a sigmoid with a scale of 400. \[ \sigma(x) = \frac{1}{1+10^{\frac{-x}{400}}} \] We have the probability of A winning as \[ P(A > B) = \sigma(R_A - R_B) \] We’ll assume A wins. So the error, given that A won, is the probability of B winning \[ E_{(w=A)} = P(B > A) \] The update is just that amount of K \[ R_A^{(t+1)} = R_A^{(t)} + K E_{(w=A)} \] \[ R_B^{(t+1)} = R_B^{(t)} - K E_{(w=A)} \]
538’s NBA Elo
The FiveThirtyEight model makes three adjustments.
- After every season, all teams get regresed to the mean.
- The home team get an extra 100 points when comparing winning probabilities, as there’s home court advantage. Since the home team wins about 60% of the time, this should probably be +70 (+100 means 64% of the time!).
- K is adjusted depending on the margin of victory and the Elo difference. You win by more points, you get more of K (with a small adjustment for team strength as well).
FiveThirtyEight thankfully is very open with their models and includes a lot of content on their GitHub. Plus, they wrote a nice article describing the formulas in their version of Elo for the NBA. I re-implemented all of this and got identical results. One thing I had to manually add was how teams moved around from 1947 until now. Additionally, some teams in the 538 dataset started with non-default scores, so there’s a slight error for those teams that gets propogated.
SIDE NOTE: Errors & the logistic function
Your choice of sigmoid function corresponds to your choice of error distribution. By using a logit, Elo assumes errors are distributed according to a logistic distribution, which looks enough like (but is not!) a Gaussian/Normal distribution that we consider it general-purpose (the Central Limit Theorm claims Gaussians are general). This is the same assumption that Logistic Regression makes. Neither model assumes your errors are normal! Why? Well your sigmoid choice is just the cumulative distribution function of your error distribution. If we wanted a Gaussian, it’d be called probit regression and we’d have to use the erf, which has no simple closed-form. So instead we use the logit, it’s similiar enough and much easier to work with mathematically.
The logit is really nice: the x axis corresponds to log odds. In the base 10 logit, if you want one in ten times, then -1 gives \( \frac{1}{11} \), -2 gives \( \frac{1}{101} \), -3 gives \( \frac{1}{1,001} \), etc. Positive numbers like +2 means “in all but \( \frac{1}{101} \)” times.
Tweaking the variables
If you read the 538 article, they talk a lot about their update function, what they found K to be, etc. Does this really matter? One way to test this is to find new settings/parameters and see if we can outperform the 538 model. I used a black-box optimizer in the form of GPyOpt, but you can use anything, even random sampling, which can be hard to beat.
What did I find out? For almost any objective function I constructed (correctly picking winners, correctly outputing sensible probabilities, some weighted average of the two, etc.), I found that almost all my Elo variants performed similiarly. They all picked winners correctly about 67% to 68% of the time. My weighted wins + well-calibrated probabilities metric produced scores (higher is better, 100 is perfect) like 75.6 (538 Elo). 75.95 (Tuned Settings), 75.6 (Simple Elo, without margin of victory), 75.6 (PID model, see below). Basically they’re all almost the same. Elo is really robust to configuration. 538’s article claims their choice of K is important. I found you could get sensible results with almost any setting. I got good configurations with a K of 20, 35, 50, etc. I got good results blending end-of-season Elo towards the mean Elo with a weighting of 50%, 75% and 95%. Home court advantage? I had good results from 50 to 150. Elo didn’t really care.
In the code elo_acc is my version of 538 Elo, elo_acc_simple is my version using a standard sigmoid and no margin of victory, elo_acc_pid is the version described below and elo_acc_poly uses margin-of-victory in a general-purpose polynomial form.
Proportional–Integral–Derivative Control
Adjusting a rating up and down to get the correct win probability? That’s just a simple feedback loop. Well control theory is a fairly established field and from a controls perspective, the Elo update is just proporation control. It takes an error and adjusts the ratings with a control gain (K).
In practice, PID controllers work well for most control problems. For a PID controller, we’ll have 3 K settings, one for each of the P,I,D settings. If the standard update is P, what are the other two? Well D is simply the difference between consecutive errors. That is, we’d want to have consistent errors over time. The I term is the sum of all the errors over time. We’d want to have our model over-shoot the target as much as it under-shoots the target. Thus the update equation would look something like this.
\[ R_A^{(t+1)} = R_A^{(t)} + K_{P} E^{(t)} + K_{D} (E^{(t)}-E^{(t-1)}) + K_{I} \sum_i E^{(i)} \]
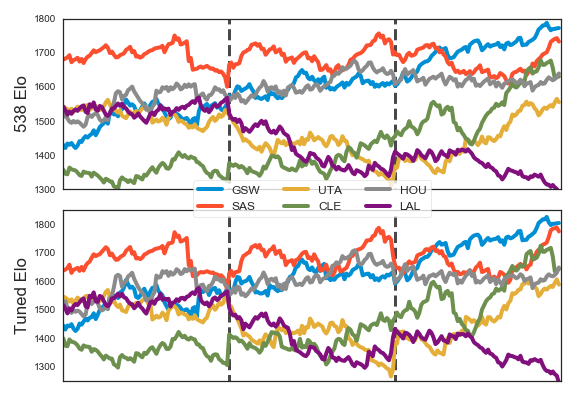
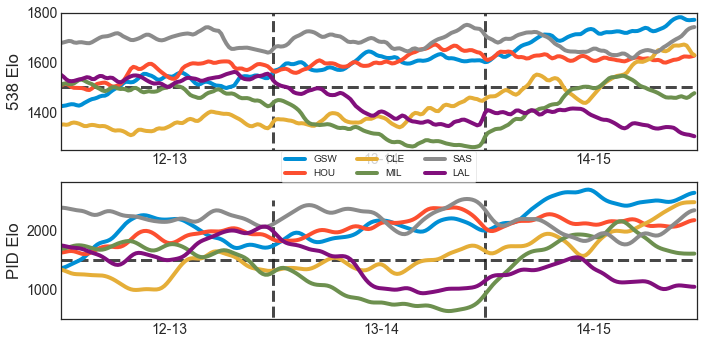
Anyways I added this to my Elo controller, with seperate I and D terms for every team, reset to 0 at the end of each season. How well did it work? I was able to get a better log-liklihood model than my other Elo variants, but it was about the same accuracy. Oh well, it was a fun idea. Here’s an example run (these graphs are smoothed as the PID output shakes a little bit and makes the curve hard to read).
Using Logistic Regression to obtain Elo
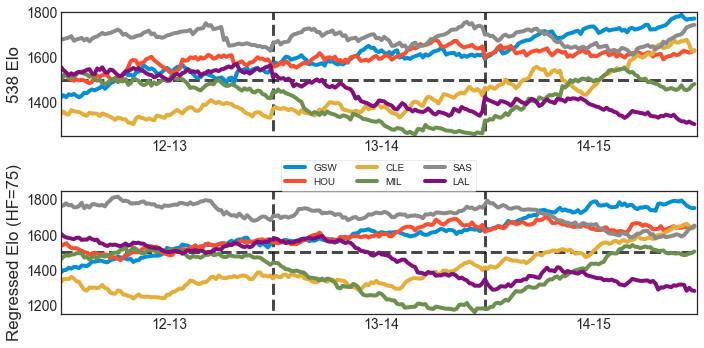
Benjamin Morris remarked that Elo is pretty much strictly dominated by having a running logistic regression over the same data, with extra clarification here. The Elo formula for win probability between A and B (where A is the home team) is \( \sigma(R_A - R_B + H) \) where \(H\) is home court advantage. Logistic Regression computes probabilities using the formula \( \sigma( \sum_i \alpha_i x_i + \beta) \). We can use this to model Elo! First, create a variable for each team. Then, each game is an example, where the home team has a +1 (an \(x_i\)) and the away team a -1 (another \(x_i\)). That’s it! Given the game results, logistic regression can the optimal coefficients for our formula (the \( \alpha_i \)s ), which are basically Elo Ratings. Additionally, it discovers home court advantage automatically (\(\beta)\). By adding 1500 and multiplying the coefficients by 173, we can obtain Elo on the standard Elo scale. The only real choice you have to make is how many games to use. More games lead to a smoother estimate. Using the latest 10 games and 100 home games (for each team, so about 300 and 3000 total).
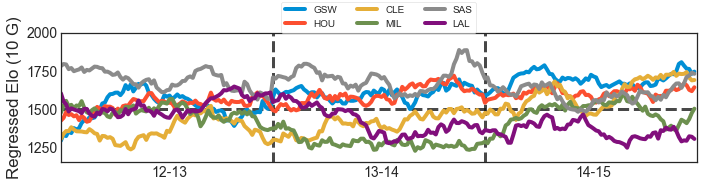
One issue I had was that each estimate independently obtains home court advantage and this was highly variable across my dataset
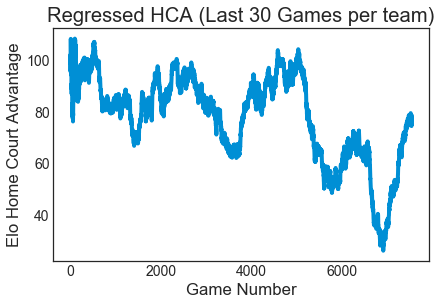
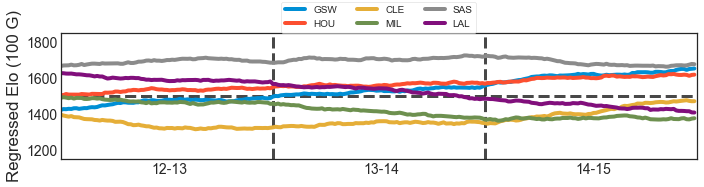
So I decided to formulate a logistic regression that had a fixed home court advantage based on the average of an automatically obtained run (75), and using a window of 30 games for each team.
The best results I got was 66.8% accuracy for a set of games where the 538 Elo model got 66.4%. I also tried weighting the model to value more recent estimates higher, but this lead to even more unstable Home Court Adjustment values in the everyone-gets-their-own-HCA case and weird curves in general; maybe I had a bug.
Building a classifier to predict games
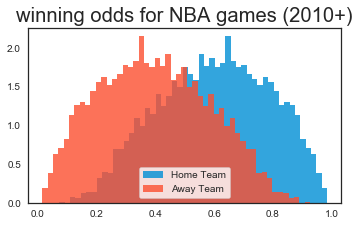
So, what about Logistic Regression to build a classifier based on just features? I defined some simple features (winning %, difference in winning % between teams, net rating, difference in net rating between teams, etc.), standardized them and added interaction terms. Then I trained a classifier over the same dataset. Guess what? 68% accuracy, about the same as Elo.
Here’s what the model predicts as the winning probabilities for all (out-of-sample) games since 2010, for home teams and away teams.
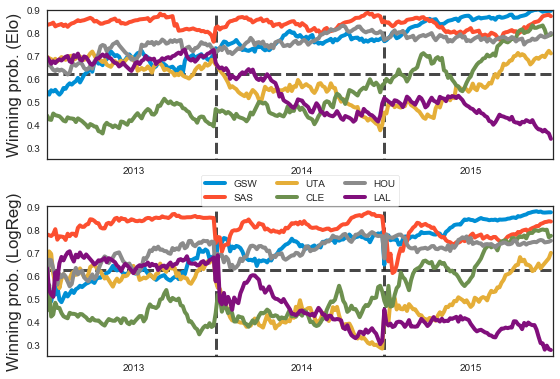
And here are the winning probabilities for Elo and the regression model, when playing a league-average team at home, across a few teams, across a few years. I find them shockingly comparable.
What ended up mattering to the classifier? Basically the net rating and how well the team did last year.
| Variable | Coeff |
|---|---|
| NetRating Diff | 0.42 |
| Prev Year W% Diff | 0.29 |
| NetRating Diff (Recent) | 0.13 |
| NetRating HomeTeam | 0.04 |
| W% Diff | 0.03 |
Combining the models
If my classifier got 67.6% of games correct, and my Elo model got 66.7% of games correct, what if I combined their results? With a simple average, I got 67.4% of games correct, so no better! With a simpler classifier, I had a slight bump, but not in general. I even tried UCB and EXP3 bandits, but only got 67% and they didn’t really develop a consistent preference over trials. Maybe a contextual bandit would work better.
Conclusion
Elo is simple and works well across tons of parameter settings. An advanced update function did not seem to help. Logistic Regression produced comparable accuracy, and a sensible model. For using just win/loss data, either method is fine. If you want better prediction, you need more information. After game-level data, the natural progression is use box scores, then play-by-play data and then player tracking data.